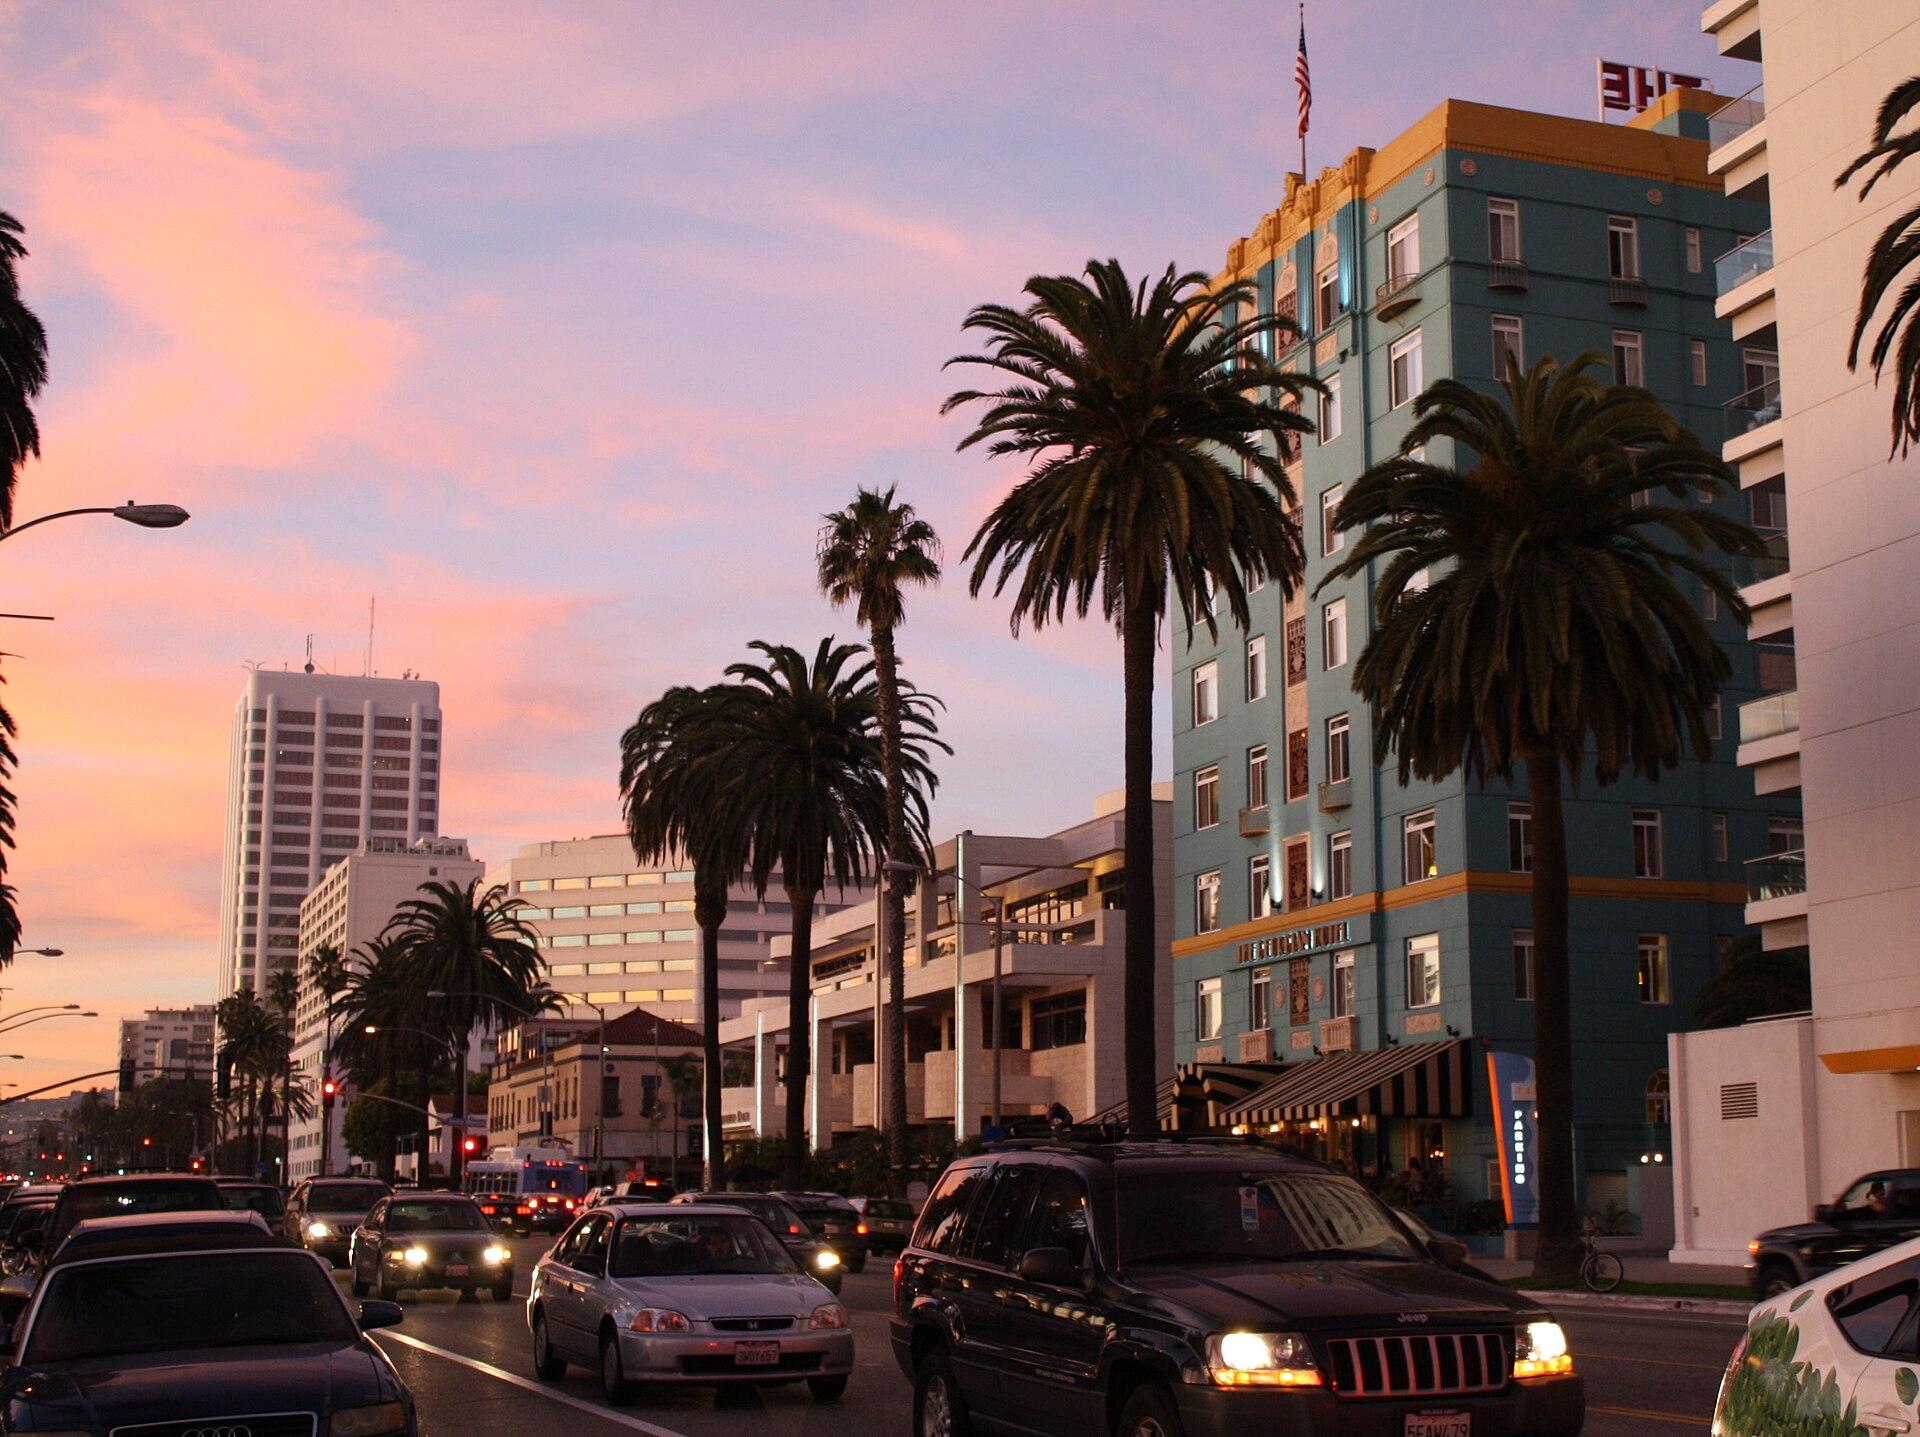

Living in Santa Monica, CA
City in Los Angeles County, California · population 91,169Updated November 2026
- Homes 139% above California
- Rent 18% above California
- Incomes 16% above California
- High violent crime
- High disaster risk
- Mild winters (50°F lows)
Santa Monica in California
Santa Monica, California, is a city of about 91,000 people that suits high-earning households who can afford very high housing costs. Median household income is about $114,885, 16% above the California average and 42% above the US average, while the median home value is about $1,755,500, 139% above the state figure. Median monthly rent is about $2,402, 18% above the state average, and property crime is 126% above the state average, so high pay comes with high costs and more crime.
Summary written by AI from the official figures on this page only.
Santa Monica in California
Key numbers
Pros and cons of living in Santa Monica
Pros
- Mild winters: January lows average 50°F
- Mild summers: July highs average 69°F
- 5 miles from Los Angeles, CA
Cons
- Homes cost 139% more than the California median ($1,755,500)
- High violent crime: 6.2 per 1,000 people (US 3.3)
- FEMA rates the county's natural hazard risk very high
Worked out from the figures below, compared with California and the US.
Cost of living in Santa Monica
| Figure | Santa Monica | California | US |
|---|---|---|---|
| Typical home valueZillow, October 2026 | $1,677,415 | — | — |
| Median home valueCensus ACS 2020-2024 | $1,755,500 | $734,700 | $332,700 |
| Typical asking rent (a month)Zillow, October 2026 | $3,540 | — | — |
| Median rent (a month)Census ACS 2020-2024 | $2,402 | $2,036 | $1,413 |
| Median household income (a year)Census ACS 2020-2024 | $114,885 | $99,122 | $80,734 |
| Typical property tax (a year)Census ACS 2020-2024 | $10,001 | $5,124 | $3,119 |
Is Santa Monica safe?
Santa Monica had 6.2 violent crimes and 41.1 property crimes per 1,000 people in 2025, against 3.3 and 15.5 across the US. Crime rates in small places and places with many visitors can look high because they're counted per resident.
| Figure | Santa Monica | California | US |
|---|---|---|---|
| Violent crimes per 1,000 peopleFBI, 2025 | 6.2 | 4.3 | 3.3 |
| Property crimes per 1,000 peopleFBI, 2025 | 41.1 | 18.2 | 15.5 |
Weather in Santa Monica
| Figure | Santa Monica |
|---|---|
| January average lowNOAA 1991–2020, Santa Monica Pier, CA station | 50°F |
| July average highNOAA 1991–2020, Santa Monica Pier, CA station | 69°F |
| Rain and snow (water) a yearNOAA 1991–2020, Santa Monica Pier, CA station | 12 inches |
Schools and education in Santa Monica
| Figure | Santa Monica | California | US |
|---|---|---|---|
| Public schools in townNCES, 2024-25 | 14 | — | — |
| Adults 25+ with a bachelor's degreeCensus ACS 2020-2024 | 70.7% | 37.1% | 35.7% |
| Median age (years)Census ACS 2020-2024 | 42.7 | 37.9 | 38.9 |
We count public schools by address; we don't rate them.
Hidden costs and risks
The typical property tax bill is $10,001 a year (about 0.57% of the median home value), compared with 0.70% across California and 0.94% across the US.
FEMA rates Los Angeles County's overall natural hazard risk as very high, with the highest ratings for flooding, wildfire, coastal flooding, tornado and heat wave. Home insurance often costs more where flood, storm or wildfire risk is high, so get a quote before you buy.
- Overall riskVery High
- FloodingVery High
- Coastal floodingRelatively High
- HurricaneNot rated
- TornadoRelatively High
- WildfireVery High
- Heat waveRelatively High
Ratings are for the whole county, compared with every other US county. “Not rated” means FEMA found no meaningful risk or had too little data.
Daily life
- Home internet94% of households have broadbandCalifornia 94%, US 91%. Counts subscriptions, not speeds.
- Nearest big cityLos Angeles, CA: 5 milesAbout 10 minutes by car (rough estimate)
- Commute25 minutes on average, one wayCalifornia 29 min, US 26 min (Census ACS 2020-2024)
- Nearest airport with flightsLos Angeles International Airport (LAX): 7 milesAbout 15 minutes by car (rough estimate)
Distances are straight lines from the town center; drive times are rough estimates, not route directions.
Ask about Santa Monica
Answers come only from the official figures on this page.
Written by AI; numbers are checked against the data. 5 questions a day. Questions are saved, without your name, so we can see what people want to know. Please don't include personal details.
Similar towns nearby
More towns in Los Angeles County
Los Angeles · Long Beach · Santa Clarita · Glendale · Lancaster · Palmdale · Pomona · Torrance · Pasadena · East Los Angeles · Downey · West Covina · all 137 towns